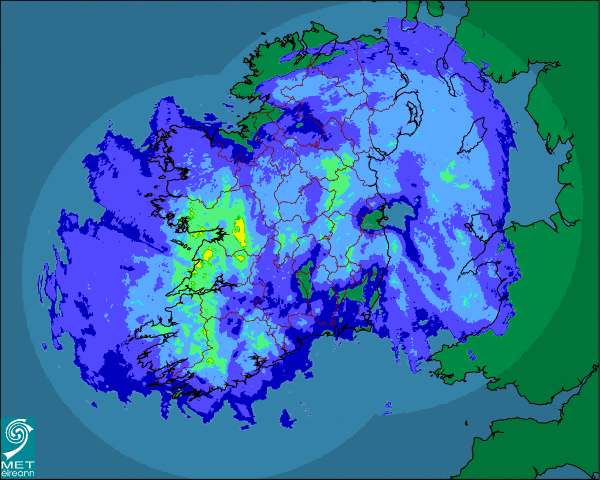
How often do you get wet cycling to work?
Cycling in Ireland is taking off. The DublinBikes scheme is a massive success with over 10 million journeys, there’s large increases in people cycling in Irish cities, there’s a good cyclist community, and infrastructure is slowing improving around the country.
However, Ireland is a rainy place!
It turns out that you’ll get wet 3 times more often if you’re a Galway cyclist when compared to a Dubliner. Dublin is Ireland’s driest cycling city.
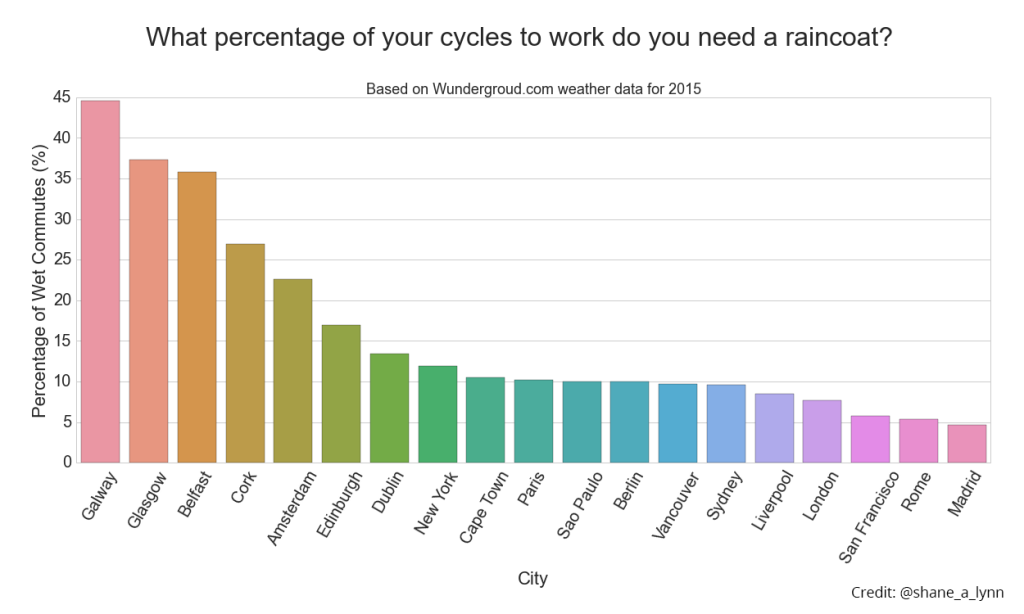
End Result: Percentage of times you got wet cycling to work in 2015 for cities globally. We’re wet, but 2015 was a particularly bad year for Irish weather. Here’s hoping for 2016!
Overall, Ireland lives up to the wet reputation – we require raincoats and (very uncool) waterproof pants a bit more than many international spots!
In this post, we examine exactly how many times cycling commuters got rained on in 2015, and we compare this to cities internationally. Data is taken from the Wunderground personal weather stations (PWS) network. If you’re interested in the techniques and repeating this analysis (Python, Pandas, & Seaborn) head here.
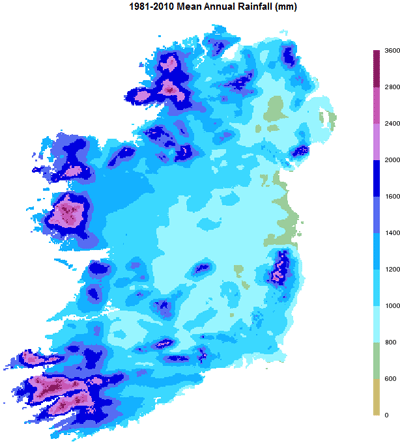
Average Annual Rainfall across Ireland is heavily biased to the Atlantic Coast, varying from 600-800 mm in Eastern Ireland to over 3000 mm in the West.
When do you cycle to work?
To look at the weather data, we assume that:
- Your cycle to work happens between 8.15am and 9.00am and you cycle home between 5.15pm and 6.00pm.
- You only cycle to work on Monday-Friday. (clearly not working at KillBiller.com)
- If it rains at any time during these periods, with any amount, that’s deemed a “wet cycling day”.
Dublin cyclists
In 2015, it rained on 181 of the 365 of days at a weather station in Conyngham Road, Dublin*.
Eliminating weekends and looking only at commuting times; in 2015, Dublin cyclists would have gotten wet 35 times, or 13% of their 261 working days!
In Dublin, commuting cyclists got wet thirty-five times in the year, and very few of those wet cycles would have been a downpour. According to the data, Dublin cyclists had a completely dry February and a rain jacket was needed 2-3 times per month on average, even in Winter.
Here’s a monthly breakdown of wet and dry cycles in 2015 for cycling commuters every work day in Dublin. The cycling commute in Dublin is not as wet as you’d think!
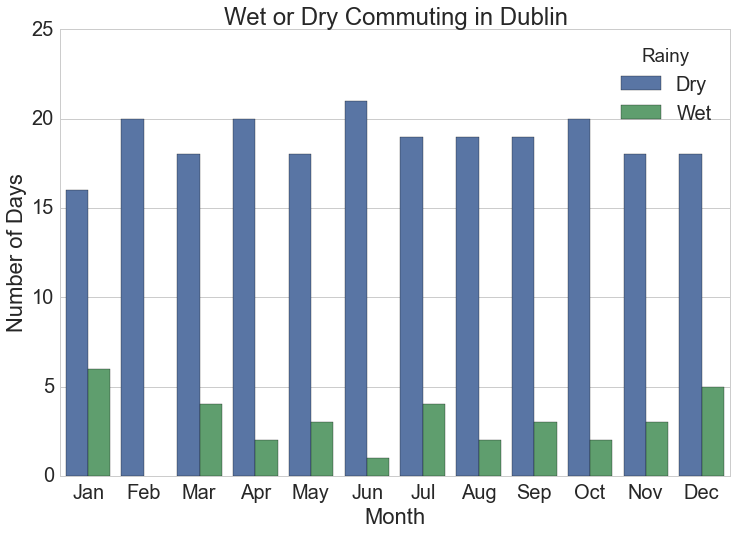
Number of days monthly when cyclists get wet commuting at typical work times in Dublin, Ireland. Note the completely dry February, and the relatively even spread of days between winter and summer.
*The rainfall figure is roughly in line with Met Eireann figures for Ireland, where we’d expect 151 wet days on the east coast and we know that 2015 was particularly wet.
How does Dublin compare to cycling commutes in Galway, Cork, and Belfast?
Other Irish cities are not dry havens:
- Cyclists in Galway required mudguards for 115 working days in 2015, or 44% of their commuting cycles (total of 261 wet days in Galway!);
- Cork doesn’t fare much better, at 67 working days (27 %)*; and
- Belfast (Queens University) dripped on working cyclists 36 % of the time, or on 93 of their trips.
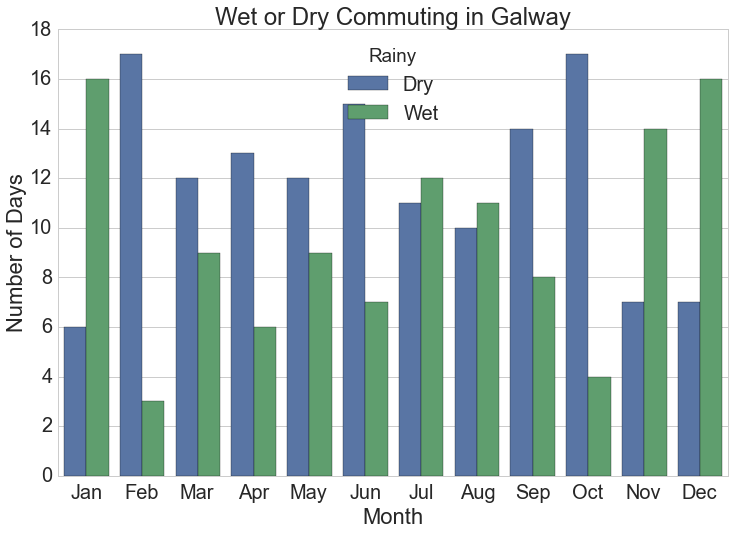
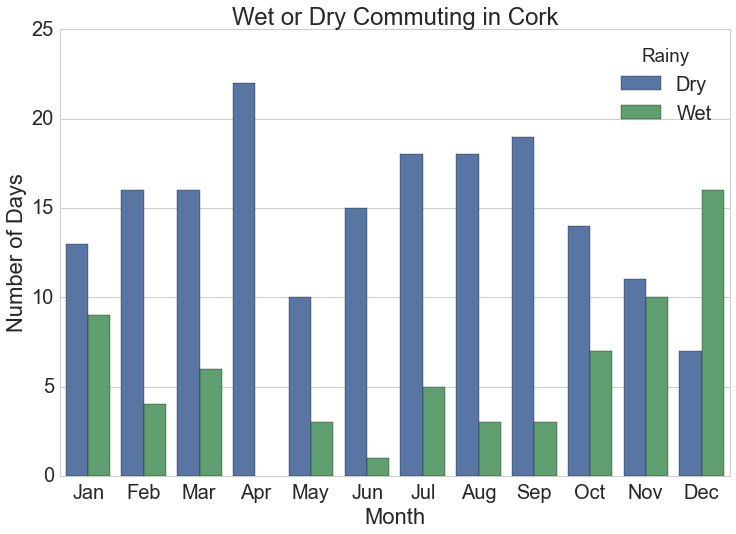
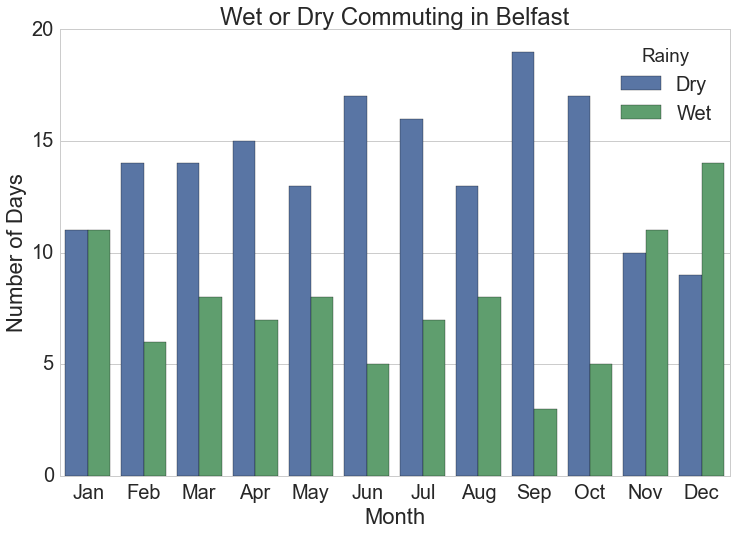
* Note that the Cork station at Blackrock was missing about 20 days data in June 2015.
Could you just cycle to work at a different time?
An interesting way to look at the data is to examine how many hours in the day is rain actually falling. If you had a very flexible workplace, could you just dodge the rain!? We can look at the number of hours per day during which rain was recorded. As a visual, you can see variations between the cities in Ireland, and that we clearly need raincoats year round.
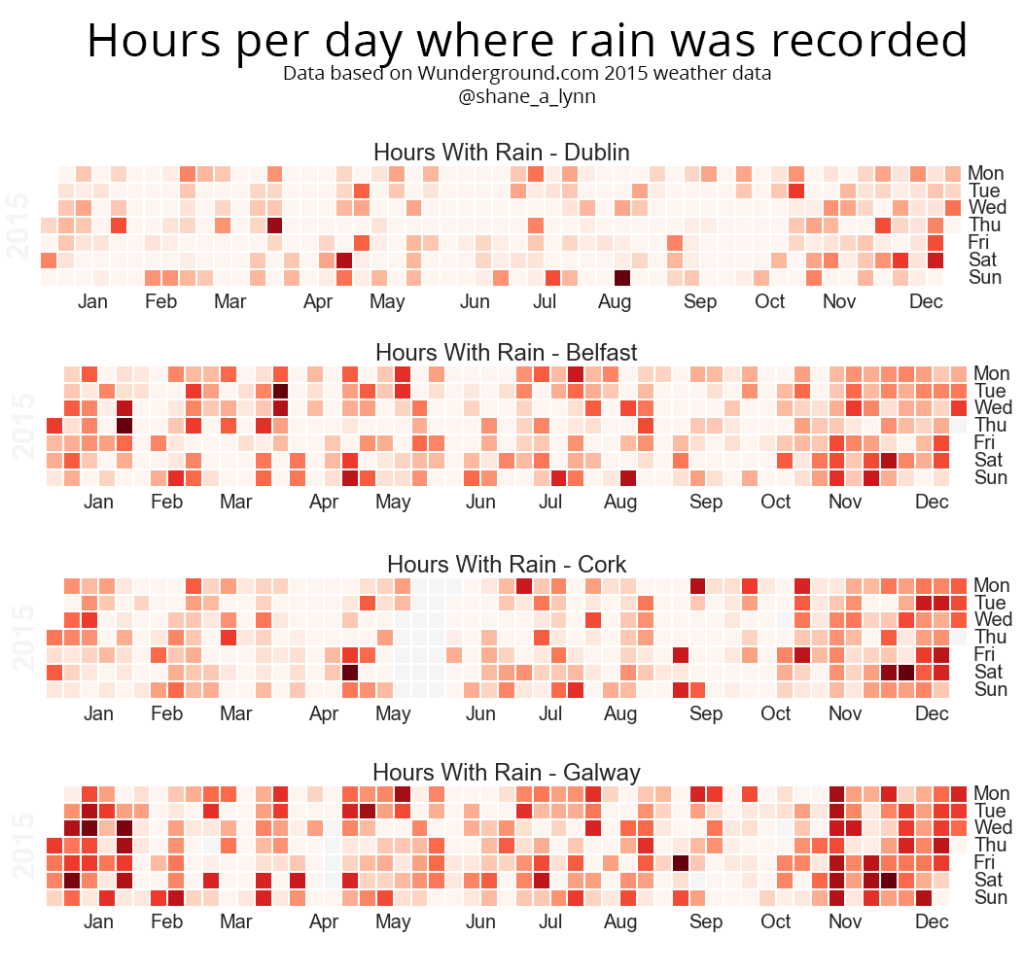
How many hours a day does it rain in Dublin, Belfast, Cork, and Galway? Darker colours represent more hours with rain – with the darkest red being 24 hours. Unfortunately for the westerners, Galway fared worst here too. Although there is a chance that the particular weather station chosen is in some sort of bath/shower…maybe.
How does Ireland stack up for wet commuting globally?
Looking at 2015 rainfall data from 18 cities globally, Ireland doesn’t fare well. Galway consistently tops the charts in 2015. The graph below compares 19 international cities. Moving to Madrid anyone??

Percentage of times you got wet cycling to work in 2015 for cities globally. Galway comes out consistently as one of the wettest places for a cycling commute in the data available, but 2015 was a particularly bad year for Irish weather. Here’s hoping for 2016.
A look at the rainfall filled hours in some of the international cities obviously shows some stark differences to our Irish homes, and also that these cities have a very defined seasonal variation in weather patterns. We can take some solace that we’re not alone – our Scottish friends also stand out for rainy cycles.
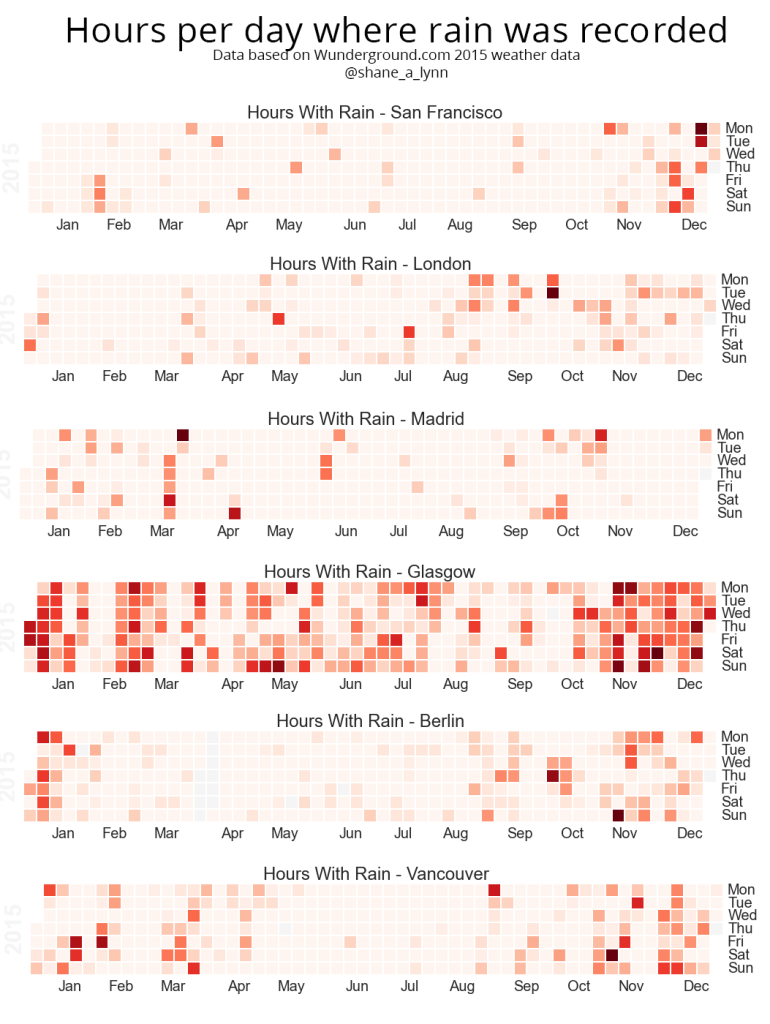
Internationally, rainfall varies a huge amount between seasons. Overall however, Irish cyclists get a rougher deal!
Caveats
One issue that’s been pointed out with this analysis is that it rarely actually takes a full 45 minutes to cycle to/from work or school. Hence, there’s a potential flaw in the analysis in that any rain in the commuting periods makes the day “wet”.
Reducing the definition of a wet day to “a day in which there is no dry period 20 minutes at commuting times” might fix this issue – and would likely reduce the percentage of wet days across the board for all cities. If this analysis is completed, it’ll appear here.
Data sources
The data for this article was collected and plotted from weather stations at Wunderground using the Python programming language, specifically using the Pandas and Seaborn libraries. If you’re interested, you can see the details, and how to repeat the analysis, over here. The raw data is also available here, if you’re keen on that sort of thing!
| City | Total Wet Days | Total Commutes | Number of Wet Commutes | Percent Wet Commutes (%) |
|---|---|---|---|---|
| Galway | 267 | 256 | 115 | 44.9 |
| Glasgow | 186 | 254 | 94 | 37.0 |
| Belfast | 236 | 261 | 93 | 35.6 |
| Cork | 221 | 246 | 67 | 27.2 |
| Amsterdam | 195 | 262 | 62 | 23.7 |
| Dublin | 181 | 261 | 35 | 13.4 |
| New York | 100 | 262 | 31 | 11.8 |
| Cape Town | 123 | 259 | 27 | 10.4 |
| Berlin | 124 | 254 | 26 | 10.2 |
| Paris | 117 | 248 | 25 | 10.1 |
| Sao Paulo | 143 | 262 | 26 | 9.9 |
| Vancouver | 115 | 261 | 25 | 9.6 |
| Sydney | 120 | 262 | 25 | 9.5 |
| Liverpool | 148 | 261 | 22 | 8.4 |
| London | 102 | 261 | 21 | 8.0 |
| San Francisco | 62 | 262 | 15 | 5.7 |
| Rome | 61 | 261 | 14 | 5.4 |
| Madrid | 66 | 262 | 12 | 4.6 |
Updates
This post garnered some attention in the media, and was featured on:
- Broadsheet.ie under “Mean Rainfall“
- Joe.ie under “Galway is the city in the world for people who cycle to work” (maybe not the world, and maybe only for rainy days!)
- RTE1 Ray D’Arcy show on Wednesday 6th April at 3.10pm.
